Advertisement
If you're still thinking of Tableau as that sleek chart-maker, you're missing what it's really turning into. It's getting smarter — thanks to built-in AI features that handle everything from predicting trends to explaining sudden spikes in your data. And you don't have to be a data scientist to use them. These features are simple, clear, and actually useful. Below are some AI tools inside Tableau that you'll want to explore — not just for the sake of trying them out but because they genuinely make work easier.
You don't have to be a data wizard to ask questions anymore. With "Ask Data," Tableau lets you type natural language queries and pulls out visual answers instantly. No need to build dashboards or write complex SQL statements. Just type "Show me sales in California last quarter," and you'll get a chart ready to go. What makes it stand out is how it interprets misspellings, synonyms, and casual phrasing without fuss. It's quick, intuitive, and a good first step for anyone who doesn’t want to dig through layers of filters and dimensions. The cool part? It adjusts in real-time as you tweak the question.
Ever stared at a sudden spike or drop in your chart and wondered what caused it? "Explain Data" jumps in like a curious analyst, digging into the background to show possible reasons. It checks related fields, data patterns, and statistical outliers — and then lays out a bunch of possible explanations without asking you to guess. You don't have to run regression models or sit with data scientists. It lays things out with numbers, charts, and easy language so you can make sense of the trend without losing your mind. It's not just helpful — it's a time-saver when reports are due, and you're chasing anomalies.
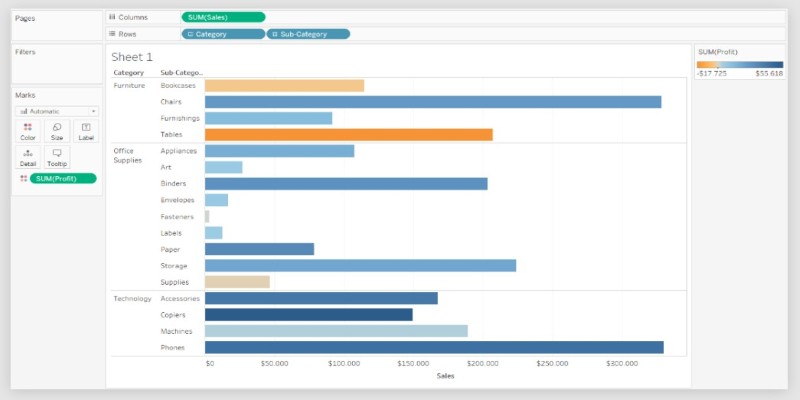
Sometimes, charts don’t cut it — especially when your audience isn't used to data visuals. “Data Stories” writes summaries in plain English (or whatever language your Tableau setup is using). It doesn’t just throw in generic lines either — it reads your selected fields and automatically builds insights based on trends, comparisons, or outliers. So instead of scrambling to explain what a bar going up means, you get a neat paragraph that says “Sales grew by 23% in Q2 due to high performance in the East region.” Great for last-minute presentations or emails to non-technical folks.
There's nothing fancy about using the forecasting feature — you don't need to build a model or know statistics inside out. You just click a button, and Tableau uses exponential smoothing to give you a trend line into the future. Want to predict next month's sales or how your inventory might shift in the coming weeks? It's all built-in. You can also adjust the forecast length and see confidence intervals — without opening another tool. It's quiet but reliable, especially for short-term planning based on historical data patterns. It won't replace complex forecasting models, but it gives you something to start with — fast.
This is where Tableau meets Salesforce’s muscle. “Einstein Discovery” inside Tableau lets you run machine learning models without coding anything. Drag and drop your fields, pick an outcome you care about (like customer churn or sales increase), and it gives you predictions and recommendations right there in Tableau. What’s more, it tells you why a certain prediction was made — with key drivers and probabilities included. It doesn't expect perfect data or deep ML knowledge. It simply sits in your dashboard and offers context backed by solid numbers. Especially useful when you're explaining results to a team that wants both insight and reasoning — not just numbers.
Cleaning data usually means clicking through endless steps. But Tableau Prep Builder now gives you smart suggestions based on patterns it spots in your data. Think: auto-suggested groupings, joins, and filter conditions. It looks at common field values, missing data, and repetitive entries — and then offers ways to fix or combine them. You still get the final say, but the suggestions help cut down repetitive tasks. Instead of scrolling through hundreds of rows trying to decide what goes where you get prompted with changes you might've missed — or didn't even think of.
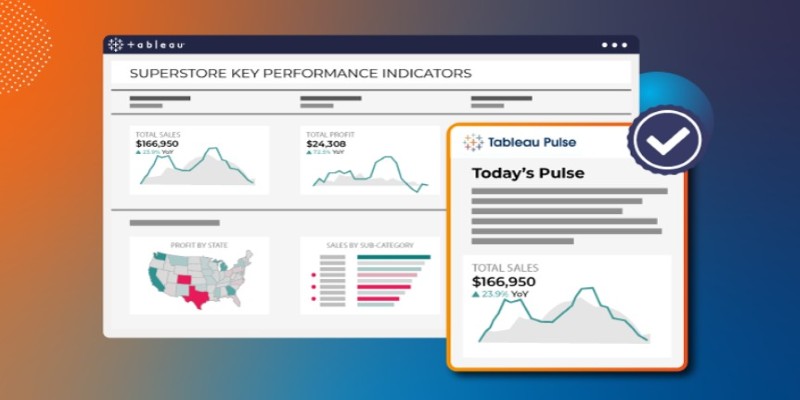
Instead of checking dashboards every hour, "Tableau Pulse" sends alerts when something important changes. These aren't basic email alerts either. They use AI to figure out if a change is significant — not just different. So if sales dropped 1%, that might be ignored, but a 20% dip in your top category? That triggers a flag. You get these alerts on Slack, Teams, or email, and they include context — what changed, by how much, and why it matters. It’s perfect for staying updated without staying glued to the screen.
Some business questions don't have straight answers. "What if we increase the budget next month?" "What happens if user traffic drops?" With Tableau's parameter controls and AI-driven modeling, you can plug in assumptions and get possible outcomes — without setting up models from scratch. This makes it easier to test different scenarios and see how your numbers would shift. You don't need extra tools or complicated formulas. Just tweak sliders, apply filters, and watch the outcomes change. It's not a simulation engine, but it covers most use cases where decision-makers want to see impact before making moves.
There's nothing flashy about how Tableau adds AI — and that's a good thing. These features work in the background, stepping in right when you need answers, predictions, or explanations. Whether it's writing out summaries, forecasting the next quarter, or quietly cleaning up messy entries, each tool solves a very specific problem. You won't need long training sessions or data teams to make sense of it all — the software just handles the mess and gives you room to think. So, if you've only scratched the surface with dashboards, now's the time to dig into the AI features built right in.
Advertisement
Need to merge results from different tables? See how SQL UNION lets you stack similar datasets together easily without losing important details

Work doesn’t have to be a grind. Discover how CrewAI and Groq help you design agentic workflows that think, adapt, and deliver—freeing you up for bigger wins

Wondering how databases stay connected and make sense? Learn how foreign keys link tables together, protect data, and keep everything organized
Learn how ThoughtSpot's AI agent, Spotter, revolutionizes conversational BI for smarter and more accessible business insights

Think picking the right algorithm is enough? Learn how tuning hyperparameters unlocks faster, stronger, and more accurate machine learning models

Curious how Tableau actually uses AI to make data work better for you? This article breaks down practical features that save time, spot trends, and simplify decisions—without overcomplicating anything

MIT is leading a focused initiative to integrate AI and emerging technologies into manufacturing, prioritizing real-world impact for manufacturers of all sizes
Understand here how embedding models power semantic search by turning text into vectors to match meaning, not just keywords

How an AI assistant is transforming last-mile deliveries by improving efficiency, reducing costs, and enhancing customer satisfaction through smarter routing and coordination

Looking for a solid text-to-speech engine without the price tag? Here are 10 open-source TTS tools that actually work—and one easy guide to get you started

Want to run LLaMA 3 on your own machine? Learn how to set it up locally, from hardware requirements to using frameworks like Hugging Face or llama.cpp

Discover Reka Core, the AI model that processes text, images, audio, and video in one system. Learn how it integrates multiple formats to provide smart, contextual understanding in real-time